FALCON+
1. System Overview
The FALCON+ system consists of three main components: a laser methane sensor mounted on the drone, a Datalogger mini-computer onboard the drone running the ground station software, and a remote client app (Android/desktop) used by the operator on the ground.
2. Hardware Installation on Drone
Connections
| Connection | Port | Purpose |
|---|---|---|
| Laser Sensor | Ethernet (RJ45) | Methane detection data (UDP 30000/30001) |
| Power | USB-C | 5V/5A from step-down converter (drone battery 12-24V → 5V) |
| 4G/5G Modem | USB-A | Internet connection for remote control |
| GPS USB (optional) | USB-A | Backup GPS (u-blox M9N recommended) |
| Touchscreen Display | SPI / Framebuffer | 3.5" onboard display for direct control |
| MAVLink (optional) | GPIO 14/15 UART | Drone telemetry (GPS, battery, flight state) |
Power Supply
The Datalogger requires 5V/5A via USB-C. Use a step-down DC-DC converter (e.g. Pololu D24V50F5) connected to the drone battery (12-24V). Some drones offer a 5V USB port for accessories — verify it provides at least 3A before using it.
GPS Priority
The app automatically selects the best available GPS source:
- MAVLink — from the drone flight controller (most accurate)
- GPS USB — standalone u-blox receiver on Datalogger
- UDP — GPS embedded in the laser sensor protocol (least accurate)
3. Powering On
- Connect all cables to the Datalogger (Ethernet to sensor, USB-C power, 4G modem, GPS if used).
- Power on the drone battery. The step-down converter feeds 5V to the Datalogger. The red LED on the Datalogger turns on.
- The Datalogger boots automatically (15-30 seconds). The AlmaG5_UAV app starts as a system service.
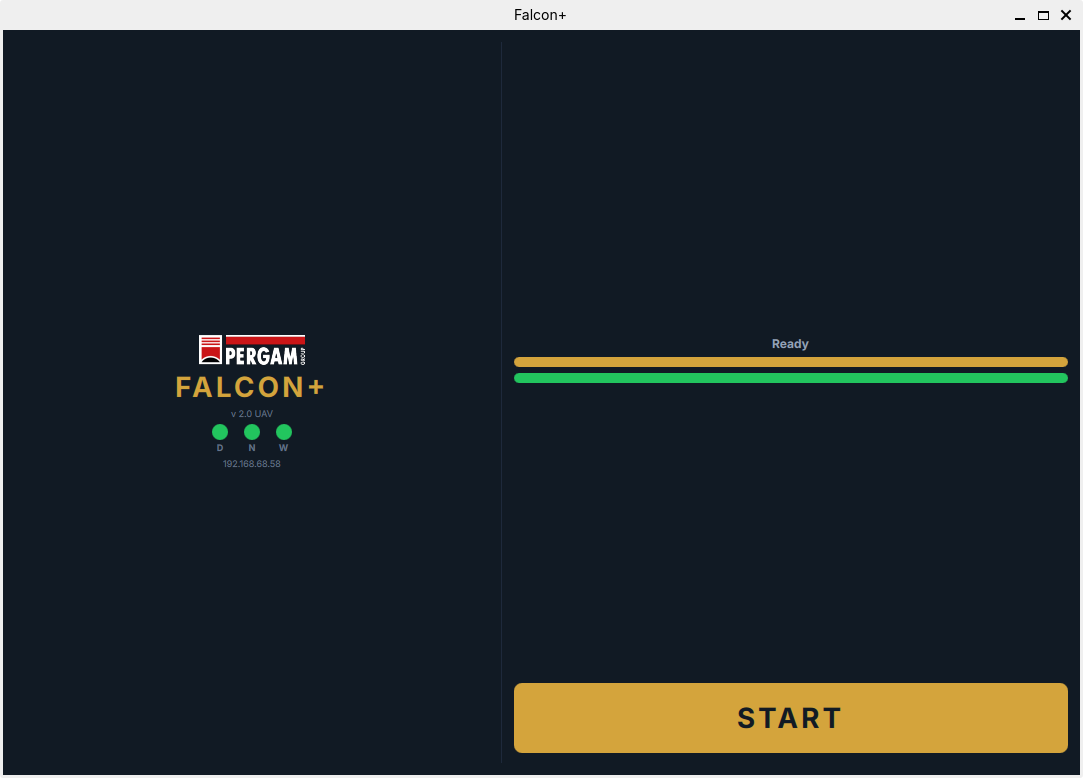
- The touchscreen shows the Setup / Calibration screen. The laser sensor begins warming up.
- Wait for calibration to complete automatically (1-5 minutes depending on temperature). Two progress bars fill up: cyan (thermal) then green (laser line).
- When the button shows START, tap it to enter the main dashboard. The system is ready to fly.
4. Touchscreen Display
The 3.5" onboard display shows the main dashboard during flight. All controls can be operated by touch.
Status Indicators (D / N / W)
Three circular indicators appear at the top of the screen:
| Indicator | Green | Gray |
|---|---|---|
| D — Detection | Laser algorithm active, measuring methane | Sensor not ready or still calibrating |
| N — Navigation | GPS fix acquired, position valid | No GPS fix — waiting for satellites |
| W — WiFi | 4G/WiFi connected, remote client can connect | No internet — remote control unavailable |
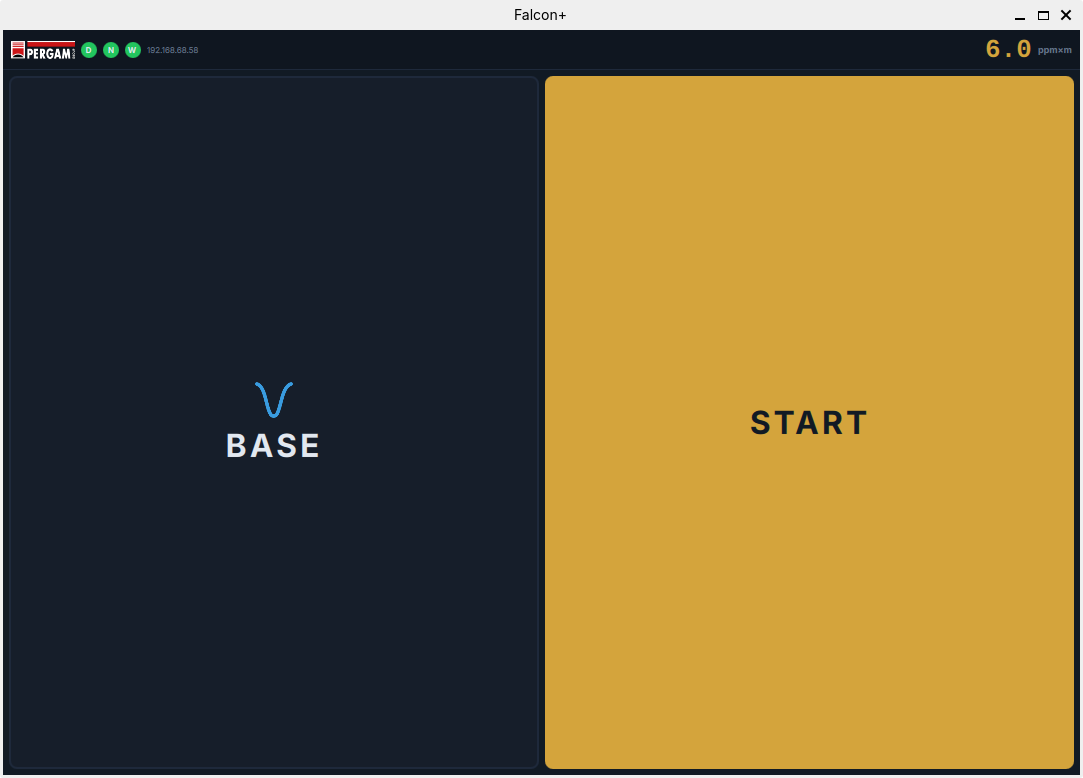
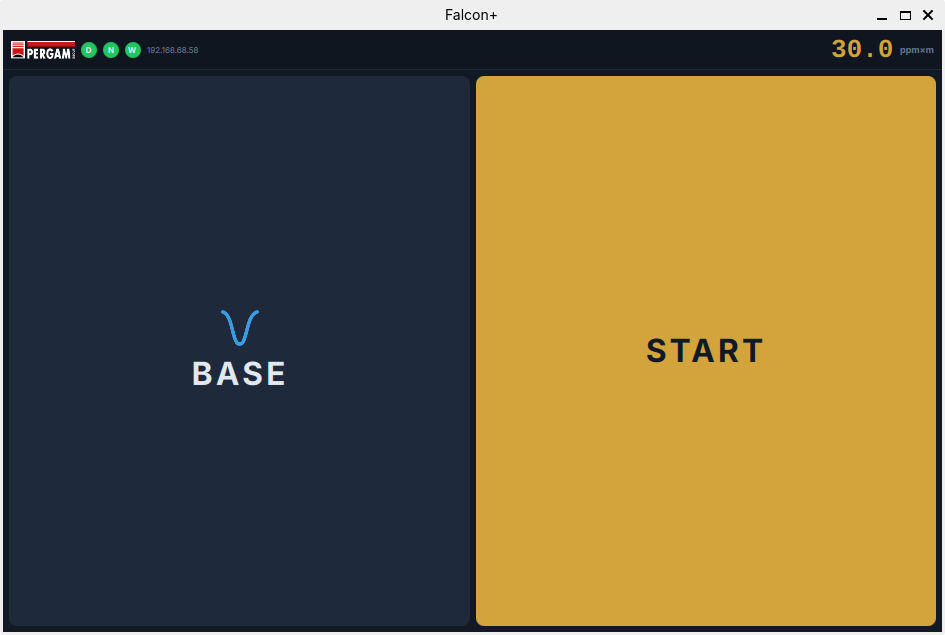
Concentration Display
The large number in the center shows the current methane concentration in ppm×m:
- Cyan — below threshold (normal)
- Red — above threshold (leak detected!)
The threshold value is displayed below the concentration number. Default is 50 ppm×m (configurable in Settings).
Finding the IP Address
The device IP address is shown in the top bar next to the W (WiFi) indicator. This is the address you need to connect from the remote client app. It looks like: 192.168.x.x or a public 4G address.

5. Operating from the Touchscreen
Setting the Baseline (BASE)
Before starting a survey, you must set the zero reference. This tells the sensor what "no methane" looks like at the current conditions.
- Make sure the drone is in clean air (no methane sources nearby).
- Tap the BASE button on the side panel (or the main area).
- The current signal level is saved as the zero reference. All future readings are measured relative to this baseline.
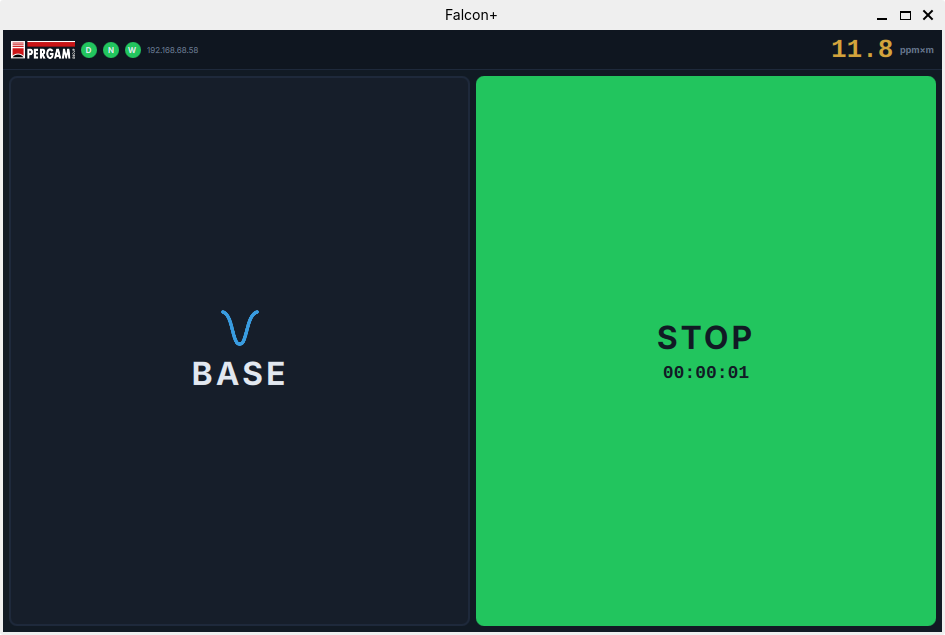
Starting / Stopping a Recording
- Tap START INSPECTION (cyan button on the side panel).
- The button turns green and shows a running timer: STOP (00:01:23)
- All data is now being recorded: concentration, GPS track, timestamps, detected leaks.
- To stop, tap the green STOP button. The session is saved automatically.
6. Remote Client App
The "Falcon+ UAV Remote" app allows the ground operator to monitor and control the system in real-time from anywhere with internet access. Available for Android and desktop (Windows/Linux/Mac).
WiFi Connection Setup
The mini-PC automatically connects to a WiFi network named Pergam. You must create this Access Point on your phone or portable router before connecting.
- On your phone or portable WiFi router, create a hotspot / Access Point with these exact settings:
| Parameter | Value |
|---|---|
| Network Name (SSID) | Pergam |
| Password | *per*gam* |
- The mini-PC detects the network and connects automatically. The W indicator on the touchscreen turns green.
- Note the IP address shown on the touchscreen top bar, next to the W indicator. You will need it for the next step.
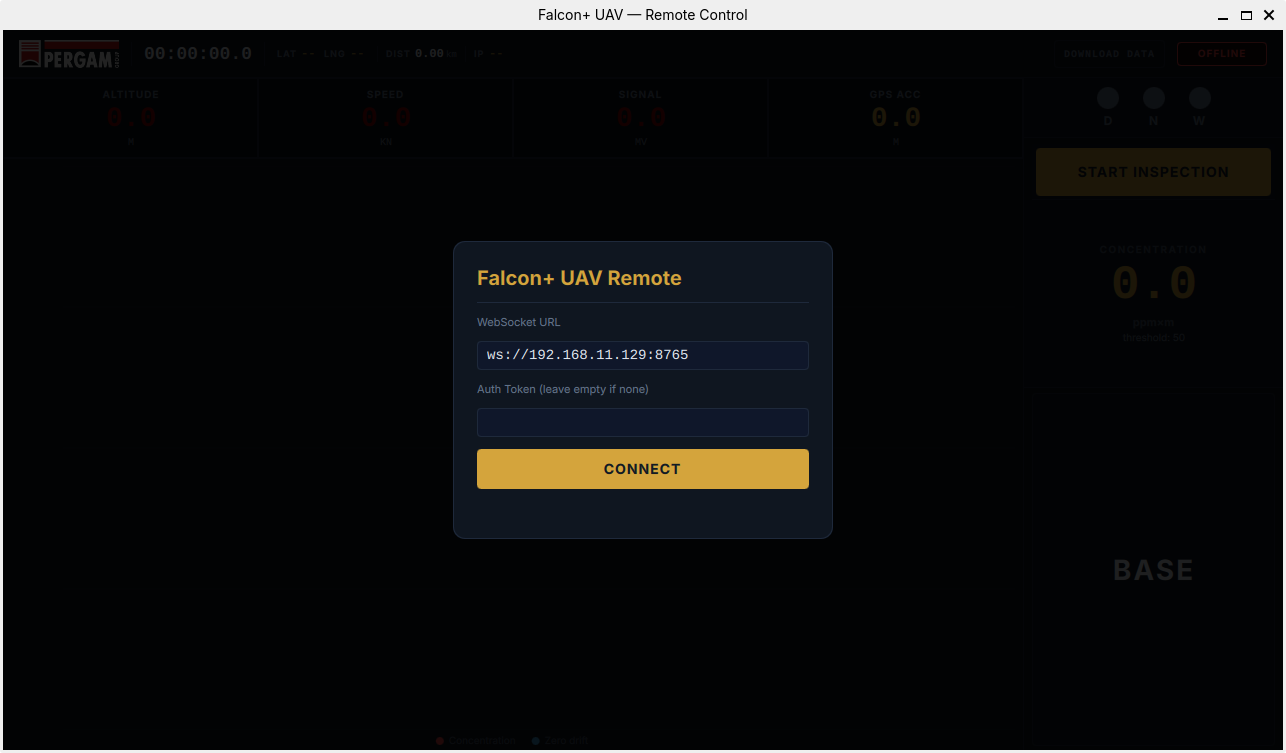
Connecting to the Datalogger
- Open the Falcon+ Remote app on your phone/tablet/PC (the same device running the Pergam hotspot, or another device connected to the same network).
- Enter the WebSocket URL: ws://<Datalogger_IP>:8765 (replace <Datalogger_IP> with the IP shown on the touchscreen next to the W indicator).
- Enter the auth token if configured (leave empty if none).
- Tap CONNECT. The status badge changes to CONNECTED (green).
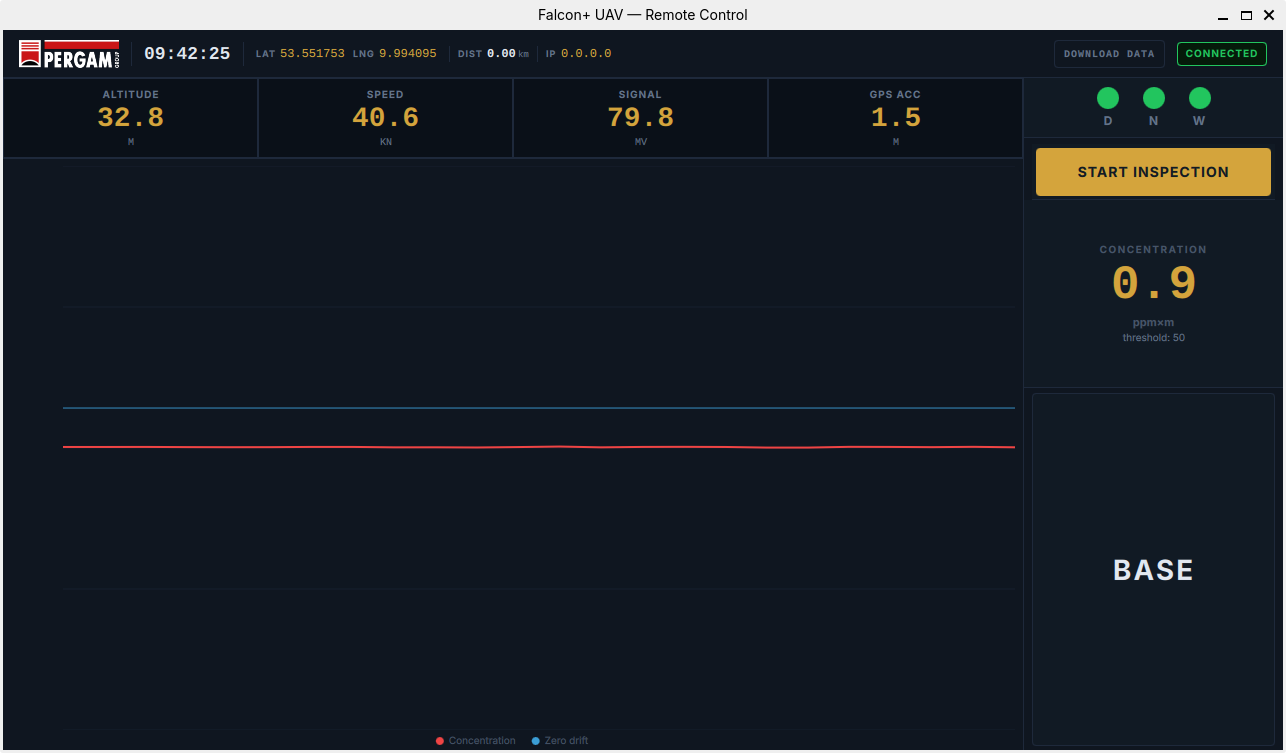
Remote Interface Layout
Top Bar
| Element | Description |
|---|---|
| Time | Current time from the drone |
| LAT / LNG | Live GPS coordinates |
| DIST | Distance flown (km) since recording start |
| IP | The drone's network IP address |
| DOWNLOAD DATA | Opens the session download page |
| Connection badge | Green "CONNECTED" or red "OFFLINE" |
Flight Parameters
Four boxes below the top bar show real-time flight data:
| Parameter | Unit | Warning Condition |
|---|---|---|
| ALTITUDE | M | < 30m or > 50m |
| SPEED | KN | < 40 or > 50 knots |
| SIGNAL | MV | < 10 mV (weak signal) |
| GPS ACC | M | > 5m (poor accuracy) |
Values turn orange when outside the normal range.
Live Chart
The center area shows a real-time scrolling graph (300 data points) with the same two lines as the touchscreen: red for concentration, blue for zero drift.
Right Sidebar
| Element | Description |
|---|---|
| D / N / W | Status indicators (same as touchscreen) |
| START INSPECTION | Tap to start/stop recording remotely. Button turns green with timer when active. |
| CONCENTRATION | Large number display. Cyan = normal, red = above threshold. |
| BASE | Tap to set the baseline remotely (same as touchscreen BASE button). |
Remote Controls Summary
| Action | How |
|---|---|
| Set baseline | Tap BASE on the right sidebar |
| Start recording | Tap START INSPECTION |
| Stop recording | Tap the green STOP button |
| Download data | Tap DOWNLOAD DATA in top bar |
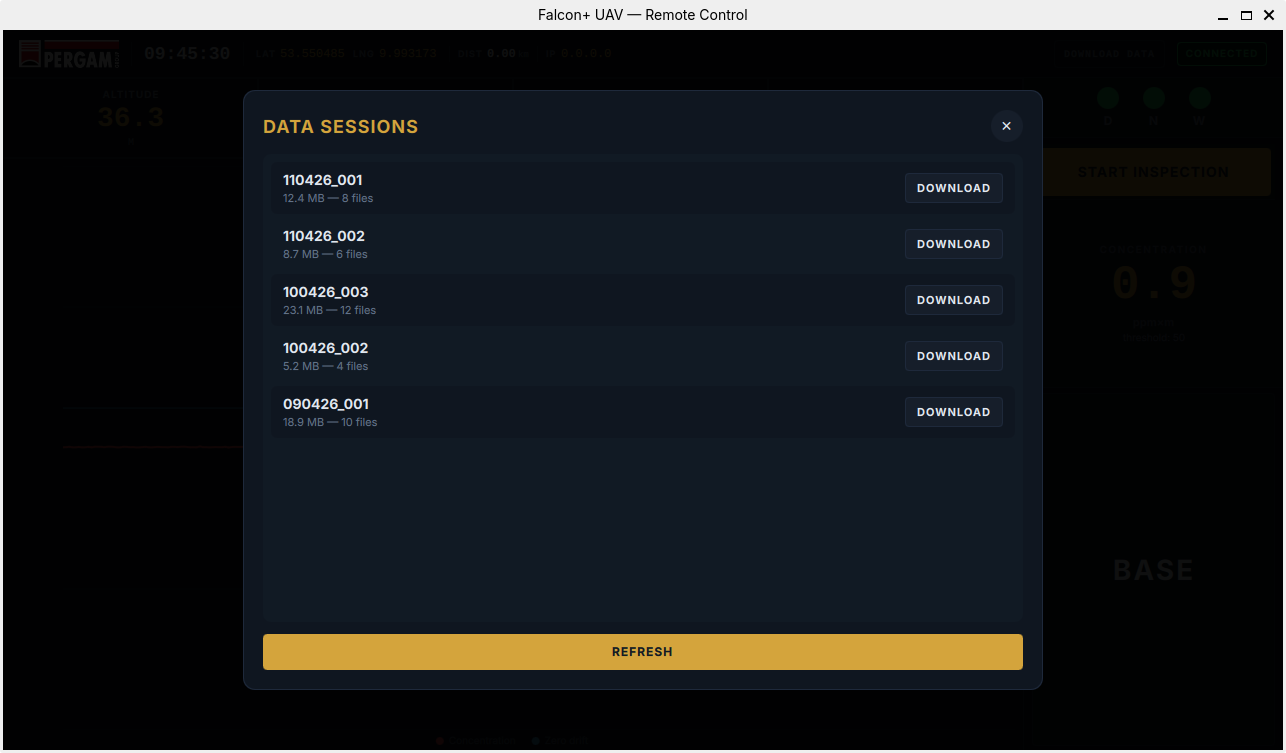
7. Downloading Recorded Data
From the Remote Client App
- Tap DOWNLOAD DATA in the top bar of the remote app.
- A list of recorded sessions appears, showing the session name, number of files, and total size (MB).
- Tap DOWNLOAD next to the session you want.
- The files are transferred to your Downloads folder. A status message shows progress and the final save path.
- Tap REFRESH to reload the session list if new recordings have been made.
From USB (Direct Access)
If the 4G connection is unavailable, you can access the recorded data directly:
- After landing, connect a keyboard and mouse to the Datalogger (or SSH via Ethernet).
- Recorded sessions are in the configured log directory (default: ~/Documents).
- Copy the session folder to a USB drive or transfer via SCP/SFTP.
Recorded Files
Each recording session creates the following files:
| File | Format | Content |
|---|---|---|
| fast_DDMMYY_N.dat | Binary | High-frequency sensor data (every sample) |
| slow_DDMMYY_N.dat | Binary | Aggregated data (slow period averages) |
| track_DDMMYY_N.dat | Binary | GPS track points |
| detr_DDMMYY_N.dat | Binary | Leak detection vectors (correlation data) |
| leak_DDMMYY_N.txt | Text (TSV) | Detected leak events with GPS position |
| note_DDMMYY_N.txt | Text (TSV) | Operator comments with GPS and timestamps |
| Info_Acq.ses | Text (TSV) | Session metadata (settings, area, operators, weather) |
8. Typical Survey Workflow
- Pre-flight — Mount the Datalogger + sensor on the drone. Connect all cables. Insert SIM in 4G modem. Power on and wait for calibration.
- Check indicators — Verify all three indicators are green (D, N, W). Note the IP address from the top bar.
- Connect remote — Open the Falcon+ Remote app. Enter ws://IP:8765 and connect. Verify "CONNECTED" badge.
- Set baseline — Tap BASE (from touchscreen or remote) while in clean air.
- Start recording — Tap START INSPECTION. The timer starts counting.
- Fly the survey — Monitor concentration on the remote app. Red numbers = leak detected. Add comments at points of interest.
- Stop recording — Tap STOP when the survey is complete. Data is saved automatically.
- Download data — Tap DOWNLOAD DATA in the remote app to retrieve session files for analysis.
9. Troubleshooting
D indicator stays gray
- Check the Ethernet cable between Datalogger and laser sensor.
- Verify both devices are on the same subnet (e.g. 192.168.1.x).
- Allow up to 5 minutes for laser warm-up in cold conditions.
- Check Settings > Network: listen port should be 30001, sender port 30000.
N indicator stays gray (no GPS)
- GPS needs clear sky view. A cold start takes 1-3 minutes.
- Check Settings > GPS: verify the serial port and baudrate (default 38400 for u-blox).
- Use the Scan button to refresh available ports.
- If using MAVLink: verify UART connection and drone flight controller config.
W indicator stays gray (no internet)
- Check that the 4G modem USB is connected and the SIM has data.
- Verify the modem LED shows a network connection.
- The remote client will not be able to connect without internet.
- All touchscreen functions work without internet — only remote control is affected.
Remote app cannot connect
- Verify the IP address shown on the touchscreen matches what you entered.
- Make sure the port is 8765: ws://192.168.x.x:8765
- Check that your phone/PC has internet access.
- If using a public 4G IP, firewall rules may block WebSocket connections.
Calibration takes too long
- Normal in cold weather. The laser needs thermal stability.
- Protect the sensor from wind during warm-up if possible.
- Do not power cycle — this restarts the calibration from zero.
Recording not starting
- Make sure calibration is complete (you must be on the main dashboard, not the setup screen).
- Check disk space on the Datalogger.
- Verify the log directory exists and is writable (Settings > Data Log).